A picture is worth a thousand words. Visualization, computer graphics, and human-computer interaction (HCI) explore how we create, interpret, and interact with visual information and computational systems. Visualization makes complex datasets easier to understand and explore. With effective visualization, an evolutionary biologist can make sense of the rich ancestral relationships in plant genomes. A geologist can use computer graphics to examine the structure of caves that would be physically inaccessible to her. A programmer can visualize the execution of her code to quickly pinpoint a problem with a parallel program running on thousands of machines. Human-computer interaction research examines how people engage with these technologies, developing interfaces and interaction techniques that make computational systems more intuitive, accessible, and effective.
Computer graphics research seeks to improve the fundamental techniques by which we create and manipulate visual content. Visualization research develops novel algorithms and representations that make complex data accessible to experts and the broader public. HCI research investigates how people perceive, understand, and interact with data and technology, designing interfaces and experiences that extend human capabilities for analysis, communication, and decision-making. Together, these areas address not only how information is presented, but also how people engage with it and use it to make sense of the world.
These research areas are unique in bringing together core computer science with fields such as perceptual psychology, art, design, and statistics. This interdisciplinary approach creates opportunities to solve challenging problems with real-world applications, ranging from scientific discovery and large-scale data analysis to AI, education, and creative inquiry. Our group, the HDC Lab, includes expertise in graph drawing, large data and systems visualization, topological data analysis, performance visualization, geometry processing, GPU techniques, physically based animation, data structures for interactive data analysis at scale, and flow visualization.
2025
S. S. Bae*, T. Fujiwara*, Chin Tseng*, and D. A. Szafir (*equally contributed). “Uncovering How Scatterplot Features Skew Visual Perception.” In Proc. ACM CHI, Article No. 681, 21 pages, 2025.
H. Jeon, H. Lee, Y.-H. Kuo, T. Yang, D. Archambault, S. Ko, T. Fujiwara, K.-L. Ma, and J. Seo. “Unveiling High-dimensional Backstage: A Survey for Reliable Visual Analytics with Dimensionality Reduction.” In Proc. ACM CHI, Article No. 394, 24 pages, 2025.
K. Takahira, K.-K. Wong, L. Yang, X. Xu, T. Fujiwara, and H. Qu. “TangibleNet: Synchronous Network Data Storytelling with Tangible User Interfaces in Mixed Reality.” In Proc. ACM CHI, Article No. 233, 18 pages, 2025.
T. Fujiwara, K. Kucher, J. Wang, R. M. Martins, A. Kerren, and A. Ynnerman. “Adversarial Attacks on Machine Learning-Aided Visualizations.” Journal of Visualization, vol. 28, pp. 133-151, 2025.
2025
S. S. Bae, T. Fujiwara, A. Ynnerman, E. Y.-L. Do, M. L. Rivera, and D. A. Szafir. “A Computational Design Pipeline to Fabricate Sensing Network Physicalizations.” IEEE Transactions on Visualization and Computer Graphics (Special Issue: Proc. IEEE VIS 2023), vol. 30, no. 1, pp. 913-923, 2024.
IEEE VIS 2023 Best Paper Honorable Mention (Top 3% of submissions)
IEEE PacificVis 2022 Best Paper Honorable Mention (Top 4% of submissions)
IEEE VIS 2019 Best Paper Honorable Mention (Top 2% of submissions)
Visualization, Graphics, and HCI Faculty
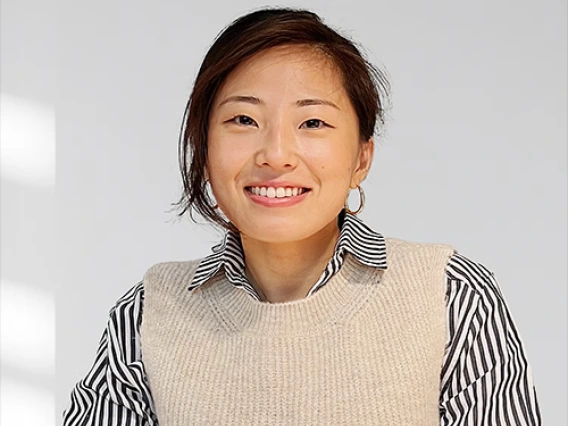
Sandra Bae
Assistant ProfessorOffice: GS 724
Interests: Human–Computer Interaction; Data Representation; Human Perception & Cognition
(Ph.D. University of Colorado Boulder, 2025)


Alon Efrat
Associate ProfessorOffice: GS 715
Interests: Geometric pattern machining, realistic input models, geographics information science and spatial databases, algorithms for mobile robots.
(Ph.D., Tel-Aviv University, 1998)


Takanori Fujiwara
Assistant ProfessorOffice: GS 734
Interests: Visual Analytics, Data Visualization, Data Science, Machine Learning, Human-Computer Interaction
(Ph.D., University of California, Davis, 2021)


Dan Wang
Assistant ProfessorOffice: GS 735
Interests: Computer Vision, Computer Graphics, Artificial Intelligence
(Ph.D. University of British Columbia)

PhD Students

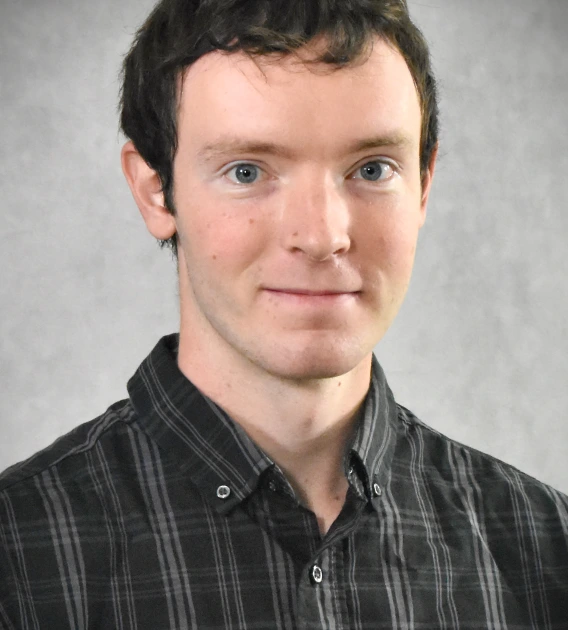
Tanner Finken
PhD StudentOffice: GS 756
Interests: Data Visualization, Topology
Advisor: Dr. Josh Levine
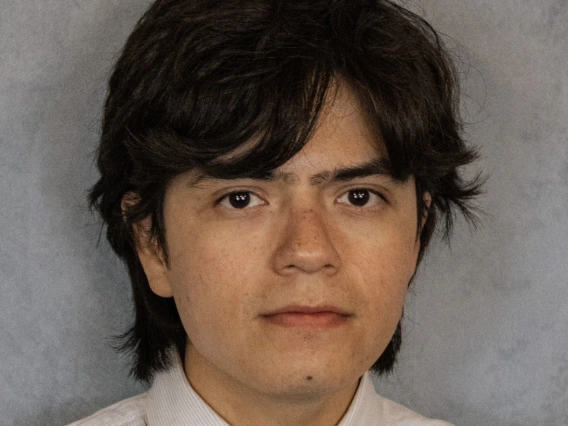
Emiliano Islas
PhD StudentOffice: GS 756
Interests: Machine Learning, Computer Vision and Graphics, Model Selection, Surrogate Modeling
Advisors: Dr. Josh Levine


Shreya Nupur Shakya
PhD StudentOffice: GS TBD
Interests: Data visualization and Graphics
Advisor: TBD